
The Source and Creative Drilldown report breaks performance down by traffic source and creative so you can compare where respondents arrived and which experience received the traffic.
Create the report
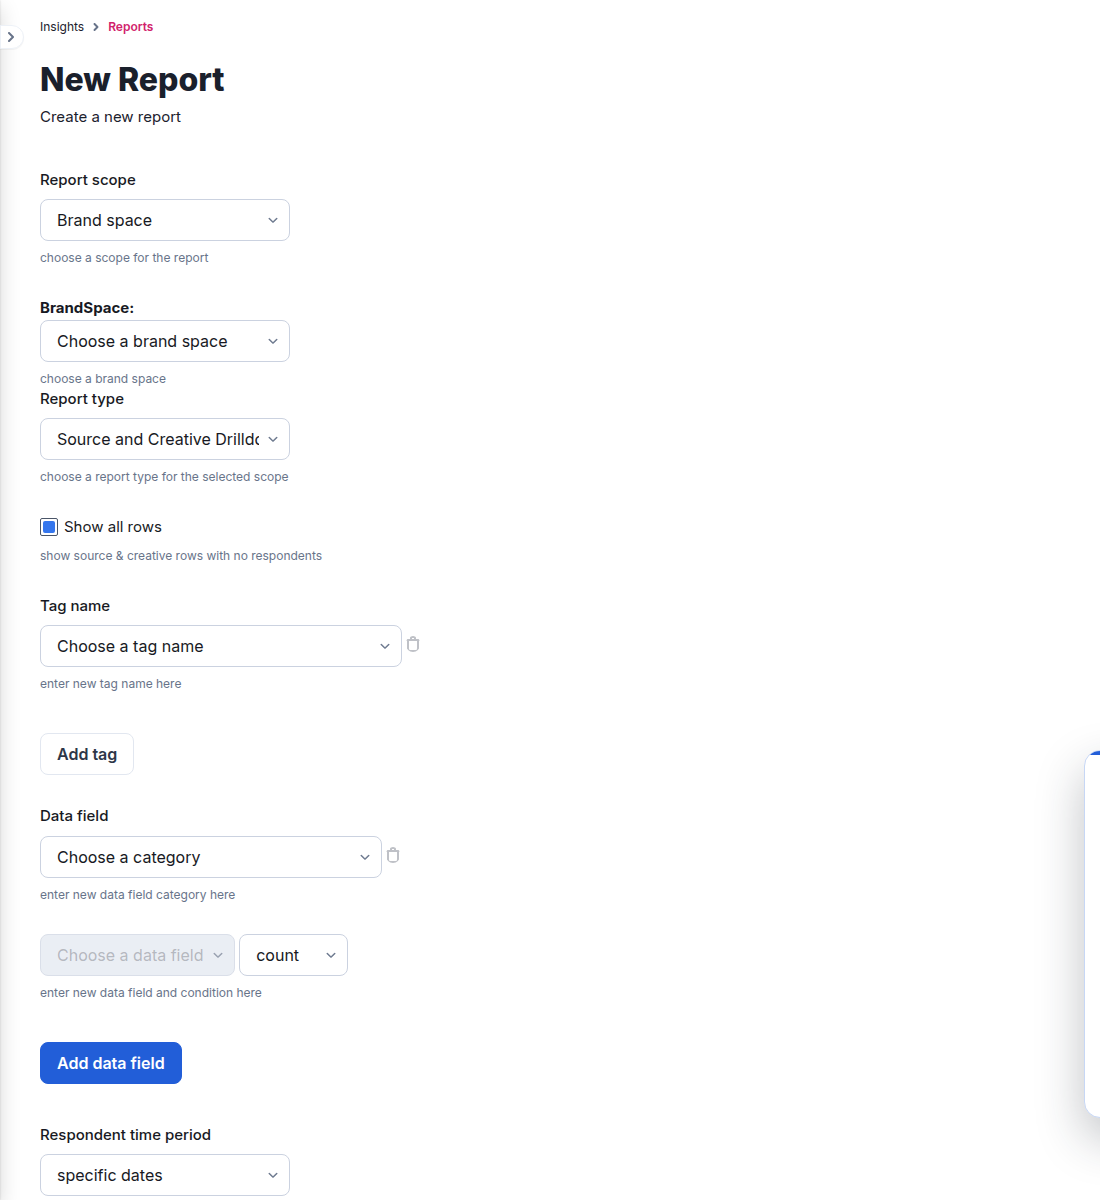
- Go to Insights > Reports and select New report.
- Select a report scope that offers the drilldown. For a Brand space report, select the Brand space and then choose Source and Creative Drilldown.
- Enable Show all rows when sources or creatives with no respondents should be included.
- Optionally add tag columns and data-field calculations. Available data-field calculations include count, conditional count, and average, depending on the selected field.
- Select the respondent time period.
- Run the report now, or provide a title and save a recurring schedule.
Output and scheduling
The current drilldown form supports spreadsheet or CSV output. A saved report can run on a daily schedule, selected weekdays, or monthly on the 1st or 15th, and can be delivered to the configured email recipients.
Use this report when you need row-level source and creative comparison. Use a Summary report when the goal is a compact roll-up for one scope.
