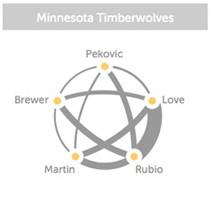
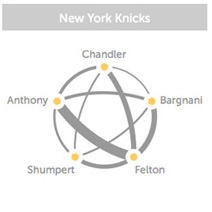
The 2013-2014 season is the NBA’s first full year using SportVU technology in all NBA arenas, and basketball analytics have never been more powerful. For the non-statheads, SportVU is a six-camera system installed in the rafters of NBA arenas that collects incredibly detailed data about player movement 25 times per second. Examples include speed, distance to the ball, directional movement, touches, and more. SportVU began a test run in 2011-2012 and expanded to include the entire league this year. The NBA made the data open and free to the public in November on a special section of NBA.com. This week, Andy Bergmann published his latest project on the NBA’s Hang Time blog – Analytics Art: NBA Passing. Bergmann’s graphic combines simple, striking design with advanced passing analysis from SportVU data that would have been unavailable just a few months ago. The graphic depicts the number of passes between each team’s starting five players from games where all five were active and saw playing time. The thicker the line, the more frequent the passes. Bergmann’s decision to standardize the organization of each team’s starters gives the graphic a mesmerizing star-like web, which makes it easy to understand the differences between how teams distribute the ball. 


The Power of Sports Data: Visualizing Passes Between NBA Players Offers New Game Insights
Subscribe to our blog
Sign up to receive Rock Content blog posts
Related Posts
From Meta to Cara: Where Artists Reclaim Their Creative Freedom

Order badass content with WriterAccess. Just as we do.
Find +15,000 skilled freelance writers, editors, content strategists, translators, designers and more for hire.
Want to receive more brilliant content like this for free?
Sign up to receive our content by email and be a member of the Rock Content Community!
Talk to an expert and enhance your company’s marketing results.
Rock Content offers solutions for producing high-quality content, increasing organic traffic, building interactive experiences, and improving conversions that will transform the outcomes of your company or agency. Let’s talk.

