
Ion analytics combines the Performance Dashboard with saved and scheduled reports. First identify the experience’s conversion event and configure the relevant rule action to Mark as converted. Then use analytics to compare traffic, engagement, segmentation, respondents, and conversions at the appropriate scope.
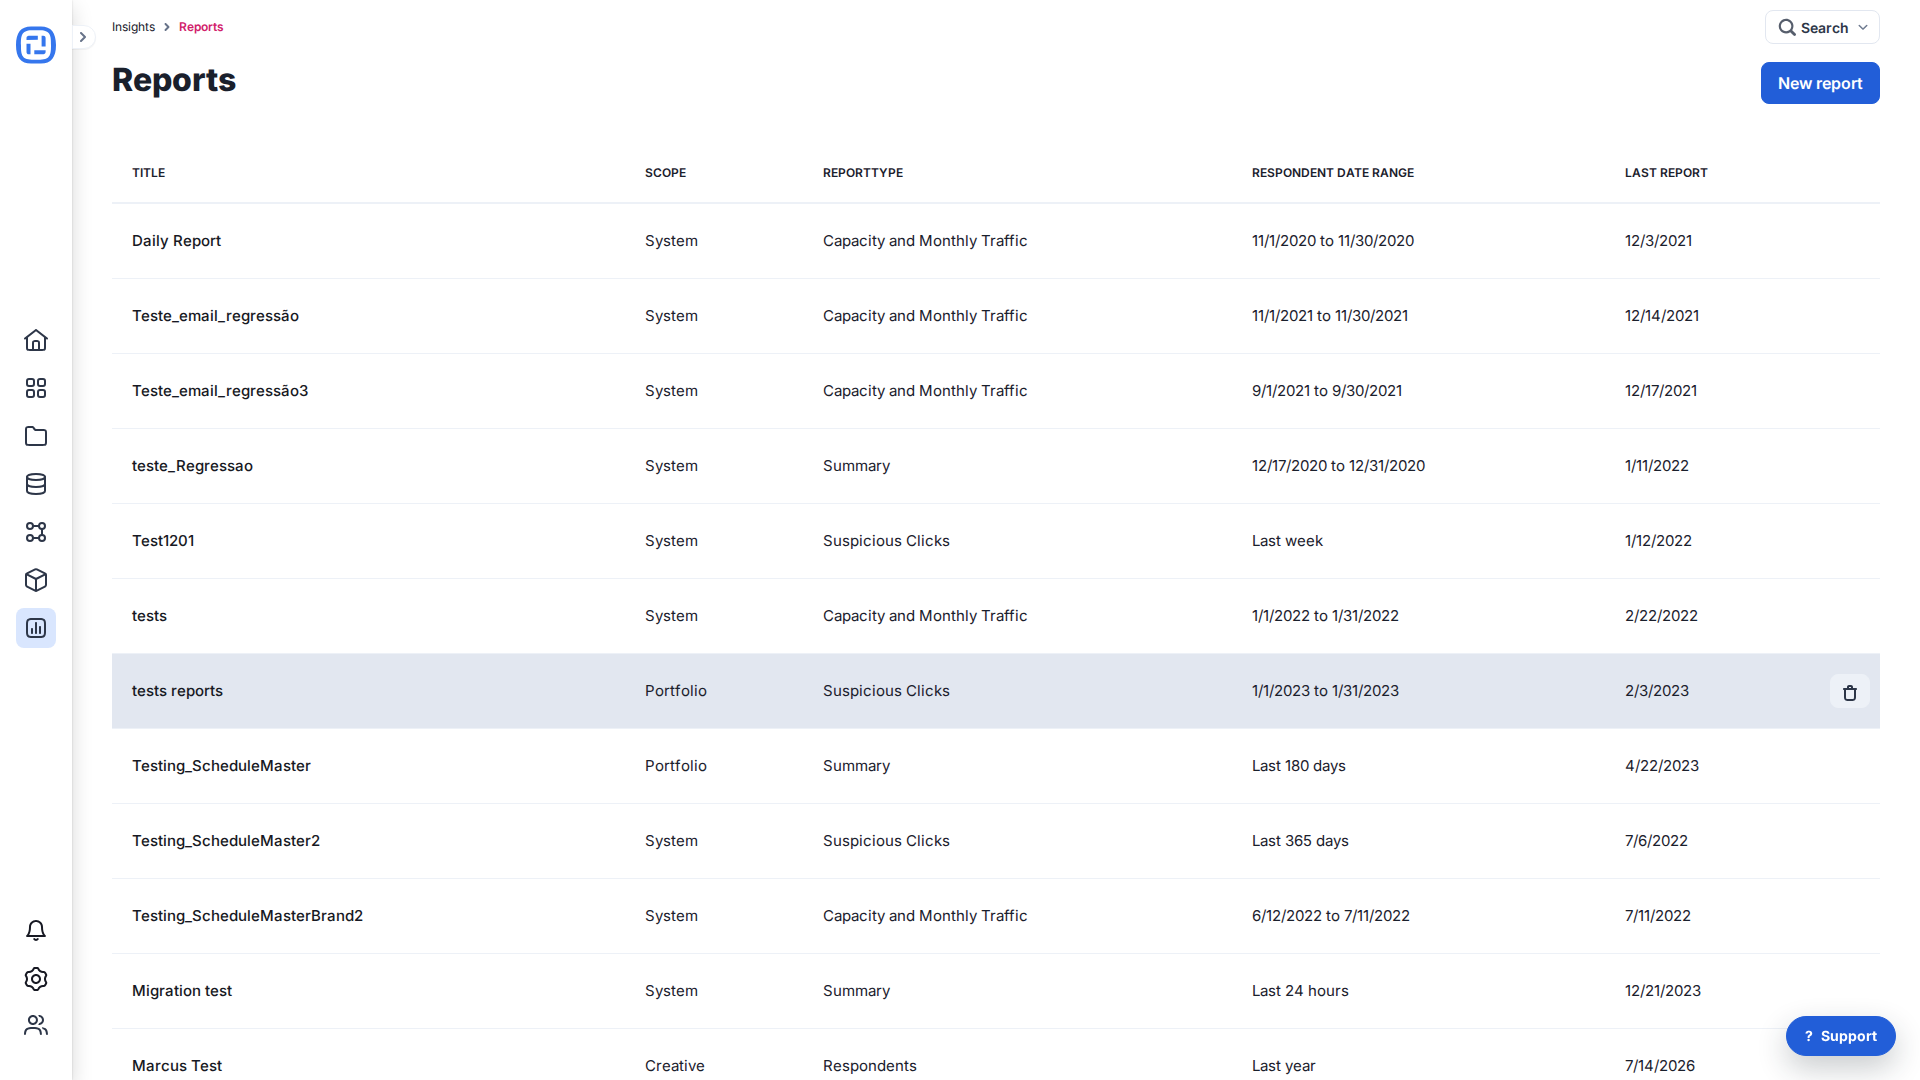
Current Academy analytics guides
- Ion Analytics Overview
- Insights: New Performance Dashboard with Highlights and Schedule Reports
- Types of Reports
- Summary Report
- Source & Creative Drilldown Report
- Implementing Google Analytics 4 (GA4) on Ion Experiences
